Derive cancer and stroma masks in CosMx data#
%load_ext autoreload

import os
import sys
import time
import logging
import re
from tqdm import tqdm
import pandas as pd
import numpy as np
import matplotlib.pyplot as plt
from PIL import Image
from natsort import natsorted

import cv2
import numpy as np
from PIL import Image
import tifffile as tiff
import copy
import random

sys.path.append(os.path.dirname(os.getcwd()))
from gridgene import get_arrays as ga
from gridgene import contours
from gridgene import get_masks
# define the logger :  can be None, and is set to INFO
# Custom logger setup
logger = logging.getLogger('contour_logger')
handler = logging.StreamHandler()
formatter = logging.Formatter('%(asctime)s - %(name)s - %(levelname)s - %(message)s')
handler.setFormatter(formatter)
logger.addHandler(handler)
logger.setLevel(logging.INFO)
CosMx Data
CosMx Data has specific characteristics that are important to be taken into account:
Resolution 1 px = 125 nm = 0.125 um 1 um = 8 px
N Transcripts -> 999 transcripts + system and negative controls
Transcripts are from standard panel (not custom made)
The data is part of a Colorectal cancer (CRC) cohort
Define the path for files
cosmx_path_s0 =  '../../cosmx_data/S0/S0/20230628_151317_S4/AnalysisResults/iz38iruwno'

folder_names_s0 = [folder_name for folder_name in os.listdir(cosmx_path_s0) if
                os.path.isdir(os.path.join(cosmx_path_s0, folder_name))]

target_files_s0 = [
    os.path.join(cosmx_path_s0, folder, file)
    for folder in os.listdir(cosmx_path_s0)
    if os.path.isdir(os.path.join(cosmx_path_s0, folder))
    for file in os.listdir(os.path.join(cosmx_path_s0, folder))
    if '__target_call_coord.csv' in file
]


files_names = natsorted(target_files_s0)
files_cosmx = copy.deepcopy(files_names)
Let’s open one file to see how it looks like
file_csv = files_names[0]   # 5
df_total = pd.read_csv(file_csv)
df_total['X'] = (round(df_total['x'])).astype(int)
df_total['Y'] = (round(df_total['y'])).astype(int)

print('max x', max(df_total['x']))
print('max y', max(df_total['y']))
print('rounded max x', max(df_total['X']))
print('rounded max y', max(df_total['Y']))

print('df shape', df_total.shape)
print('df columns', df_total.columns)

df_total['target'].value_counts()
max x 4245.27
max y 4245.32
rounded max x 4245
rounded max y 4245
df shape (1843019, 22)
df columns Index(['Unnamed: 0', 'Spot1_count', 'Spot2_count', 'Spot3_count',
       'Spot4_count', 'codeclass', 'fov', 'multicolor_spots_per_feature',
       'possible_BC_count', 'random_call_probability', 'seed_x', 'seed_y',
       'spots_per_feature', 'target', 'target_call_observations',
       'target_count_per_feature', 'target_idx', 'x', 'y', 'z', 'X', 'Y'],
      dtype='object')
target
MALAT1              110996
TPT1                 67199
KRT8                 48690
RPL37                46842
KRT18                41968
                     ...
SystemControl194         7
SystemControl10          6
SystemControl107         4
SystemControl70          3
SystemControl134         2
Name: count, Length: 1207, dtype: int64
Remove the negative controls. We get 999 genes and shape (4245,4245)
# remove Controls
df_total = df_total[~df_total['target'].str.contains('System|egative')]
n_genes = len(df_total['target'].unique())
height = max(df_total['X'] + 1)
width = max(df_total['Y'] + 1)

print(f'n genes: {n_genes}')
print(f'shape: {height}, {width}')
print(f'n hits {len(df_total)}')
n genes: 999
shape: 4246, 4246
n hits 1819904
Define GRIDGEN parameters
Define GRIDGEN parameters and obtain arrays
# param cancer
target_tum =  ['EPCAM',  'KRT19', 'KRT8', 'KRT18','KRT17','CEACAM6','SPINK1', 'CD24', 'S100A6','RPL37','S100P',]
density_th_tum = 40
min_area_th_tum =  1000
kernel_size_tum = 80

# param empty
density_th_empty = 140
min_area_th_empty = 2000
kernel_size_empty = 80
We need to obtain the arrays for the transcripts of interest: the full array and the cancer one
# this makes the sparse df to an array with the spatial information
target_dict_total = {target: index for index, target in enumerate(df_total['target'].unique())}
array_total = ga.transform_df_to_array(df = df_total, target_dict=target_dict_total, array_shape = (height, width,len(target_dict_total))).astype(np.int8)

# creating subsets
df_subset_tum, array_subset_tum, target_indices_subset_tum = ga.get_subset_arrays(df_total, array_total,target_dict_total,
                                                                     target_list=target_tum, target_col = 'target')
We are set to go! Lets get the contours:
Contours for the cancer regions using the cancer trasncripts.
Contours around the regions that have tissue (emptiness) using all the transcripts available.
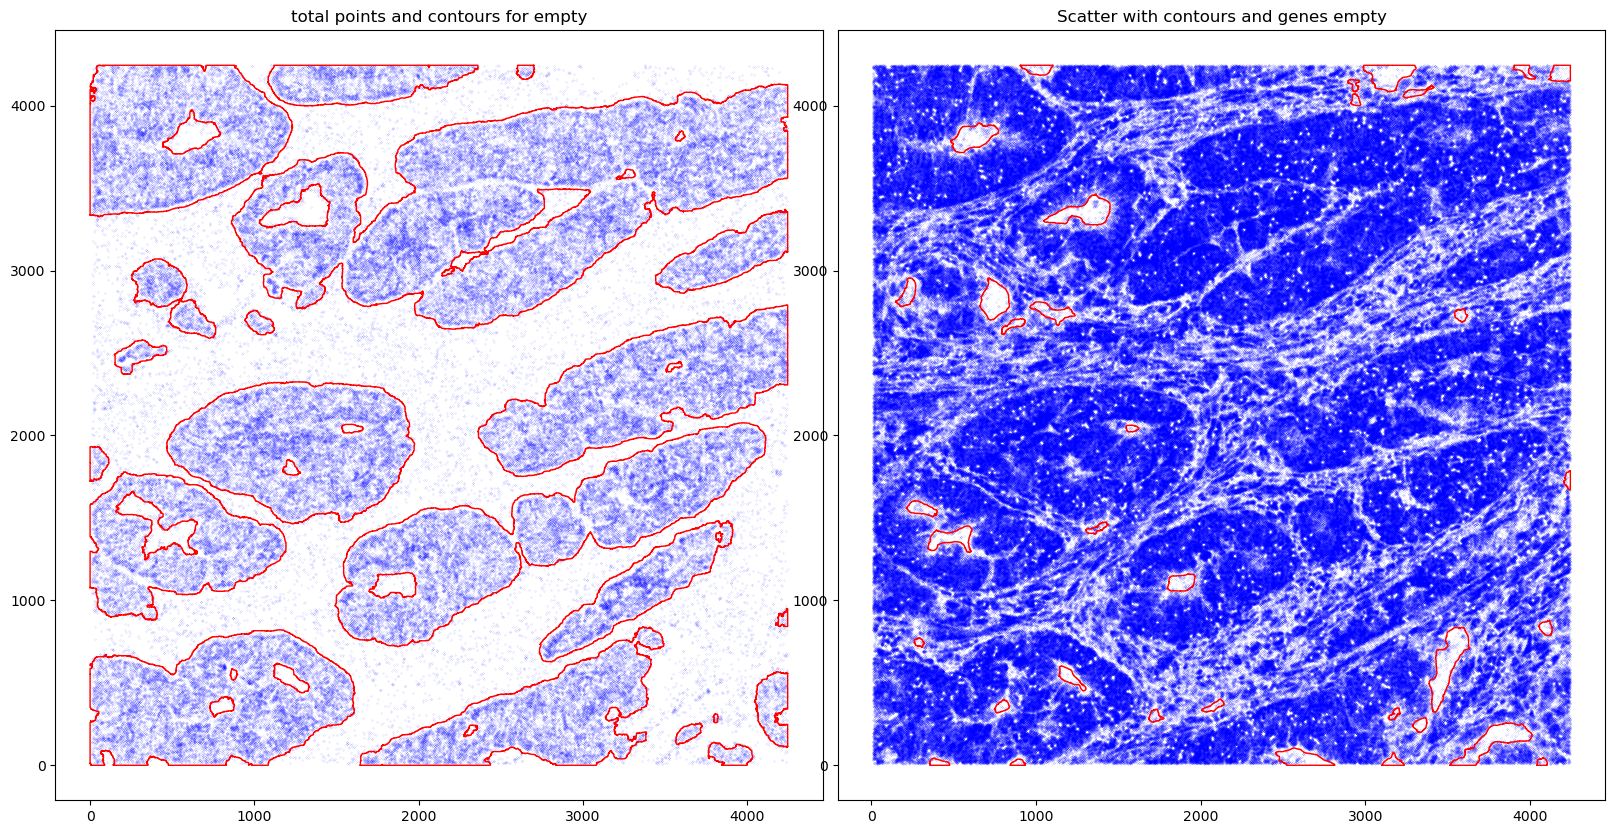
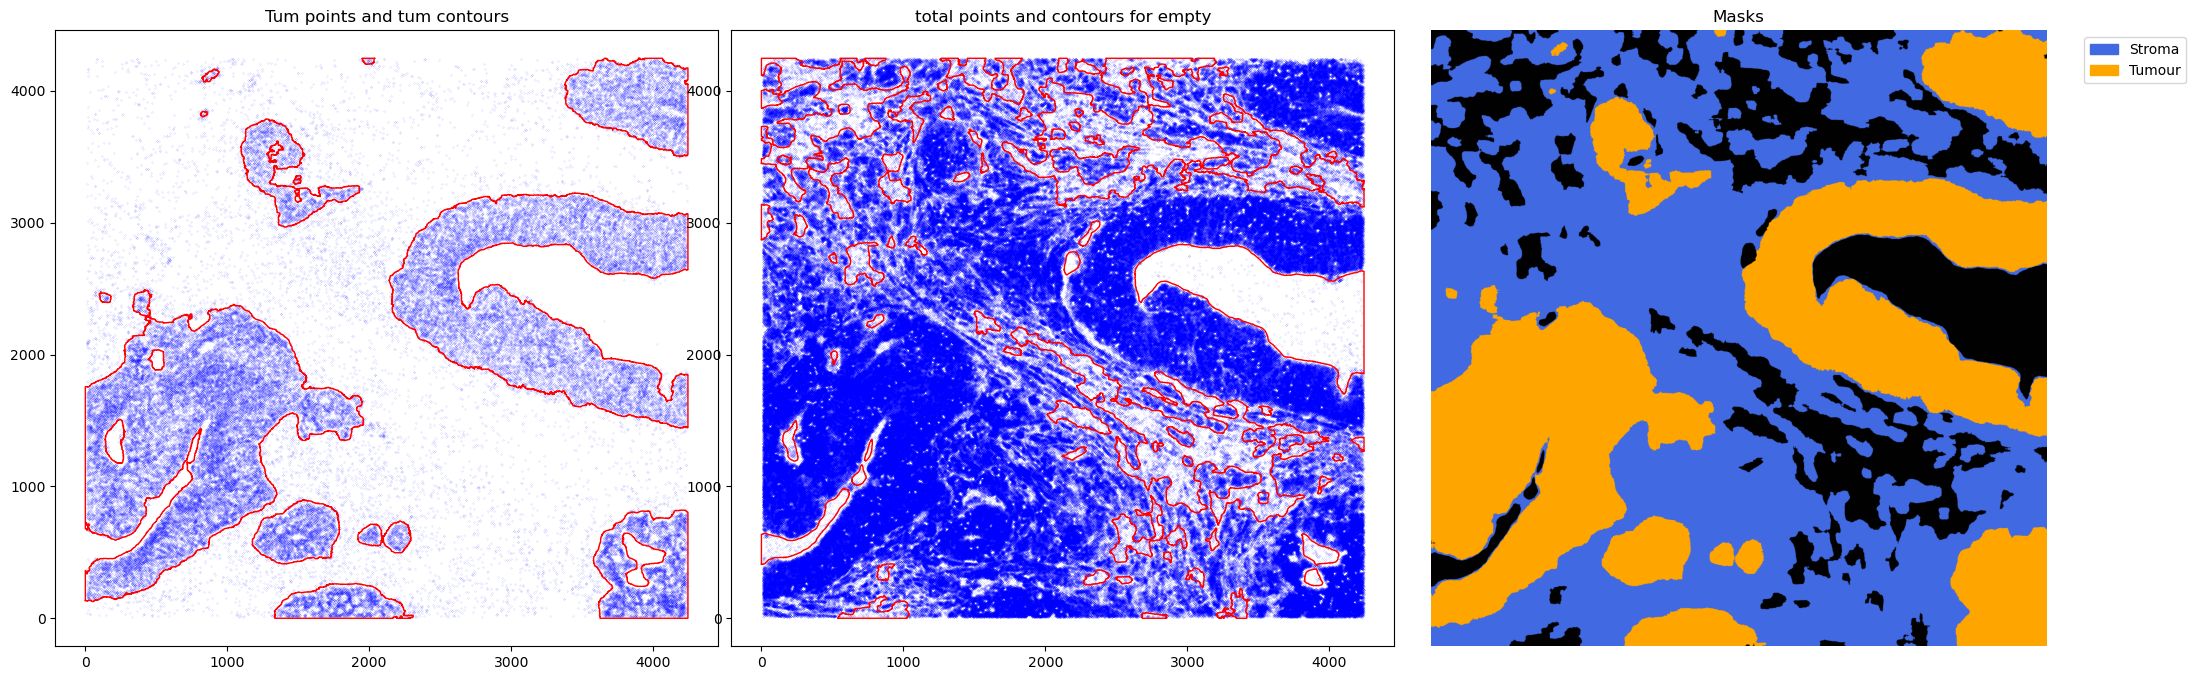
We will plot the results with the graphics available in GRIDGEN:
contours scatter - where each transcript point of that region is blue and the contour is red.
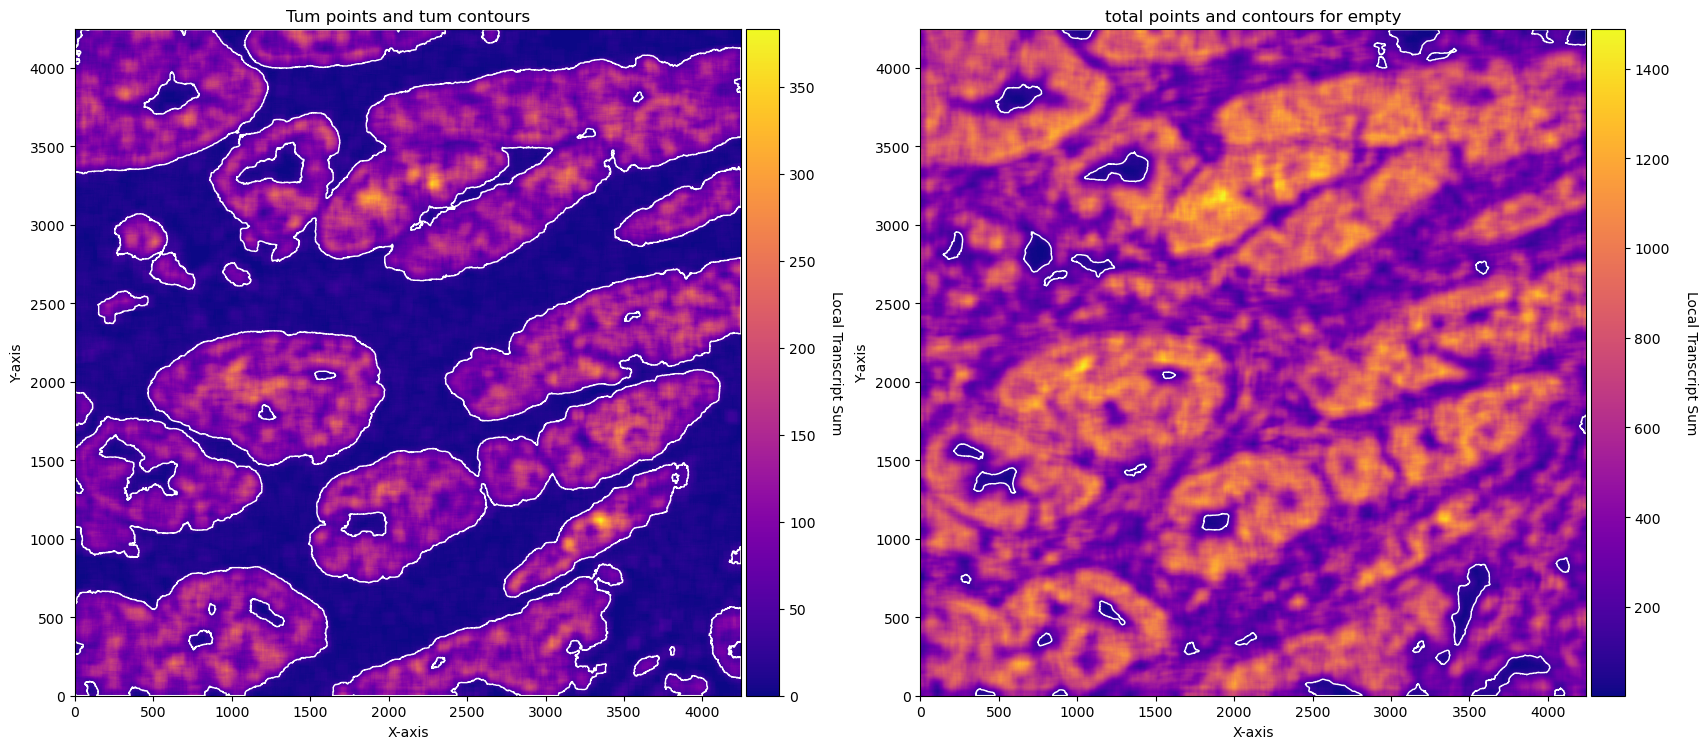
conv sum - plot with the convolutional sum image ( densities on each kernel).
# obtain contours
CTum = contours.ConvolutionContours(array_subset_tum, contour_name='tum')
CTum.get_conv_sum(kernel_size=kernel_size_tum, kernel_shape='square')
CTum.contours_from_sum(density_threshold = density_th_tum,
                       min_area_threshold = min_area_th_tum , directionality = 'higher')

CEmpty = contours.ConvolutionContours(array_total, contour_name='empty')
CEmpty.get_conv_sum(kernel_size=kernel_size_empty, kernel_shape='square')
CEmpty.contours_from_sum(density_threshold = density_th_empty,
                       min_area_threshold = min_area_th_empty, directionality = 'lower') # attention that directionality is lower here


print('====')
print('N contours for tissue area', len(CEmpty.contours))
print('N contours for cancer', len(CTum.contours))

# PLOTs -- instead of plotting just with the function for example: CTum.plot_contours_scatter, we will make a composite image

fig, axs = plt.subplots(1, 2, figsize=(20, 10))
CTum.plot_contours_scatter(path=None, show=False, s=0.05, alpha=0.5, linewidth=1,
                           c_points= 'blue',c_contours= 'red', ax=axs[0])
axs[0].set_title('Tum points and tum contours')


CEmpty.plot_contours_scatter(path=None, show=False, s=0.05, alpha=0.5, linewidth=1,
                           c_points= 'blue',c_contours= 'red', ax=axs[1])
axs[0].set_title('total points and contours for empty')
plt.subplots_adjust(wspace=0.02)  # Adjust to your preference

plt.show()


fig, axs = plt.subplots(1, 2, figsize=(20, 10))

CTum.plot_conv_sum(cmap='plasma', c_countour='white', ax=axs[0])
axs[0].set_title('Tum points and tum contours')

CEmpty.plot_conv_sum(cmap='plasma', c_countour='white', ax=axs[1])
axs[1].set_title('total points and contours for empty')

plt.show()
2025-06-12 00:17:13,137 - gridgen.contours.tum - INFO - Initialized GetContour
get_conv_sum took 0.4867 seconds
2025-06-12 00:17:13,998 - gridgen.contours.tum - INFO - Number of contours after filtering no counts: 38
2025-06-12 00:17:13,999 - gridgen.contours.empty - INFO - Initialized GetContour
contours_from_sum took 0.3738 seconds
get_conv_sum took 7.4051 seconds
2025-06-12 00:17:28,571 - gridgen.contours.empty - INFO - Number of contours after filtering no counts: 35
contours_from_sum took 7.1675 seconds
====
N contours for tissue area 35
N contours for cancer 38
Obtain masks
With the contours made. We can make the masks.
cancer masks will be equivalent to the cancer contours. Stroma masks will be the total tissue contours without the cancer areas.
Some operations can be done to get smoother masks. In the example below, holes in cancer masks are filled. This is optional.
#### obtain masks
GM = get_masks.GetMasks(image_shape = (height, width))

mask_empty = GM.create_mask(CEmpty.contours)
mask_tum = GM.create_mask(CTum.contours)
mask_tum = GM.fill_holes(mask_tum)
mask_stroma = GM.subtract_masks(np.ones((height, width), dtype=np.uint8), mask_tum, mask_empty)
mask_stroma = GM.filter_binary_mask_by_area(mask_stroma, min_area=700)

GM.plot_masks(masks=[mask_stroma, mask_tum], mask_names=['Stroma', 'Tumour'],
              background_color=(1, 1, 1), mask_colors={'Stroma': (65, 105, 225), 'Tumour': (255, 165, 0)},
              path=None, show=True, ax=None, figsize=(5, 6))
2025-06-12 00:17:39,250 - gridgen.get_masks.GetMasks - INFO - Initialized GetMasks
2025-06-12 00:17:39,287 - gridgen.get_masks.GetMasks - INFO - Subtracted masks from base mask.
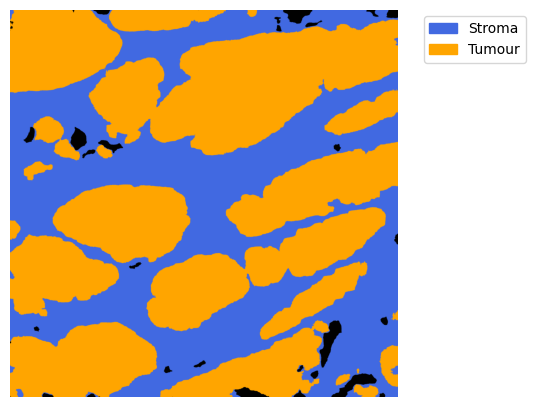
Note the holes that were visible in the contours are filled in the cancer mask. Without GM.fill_holes(mask_tum) this would not happen.
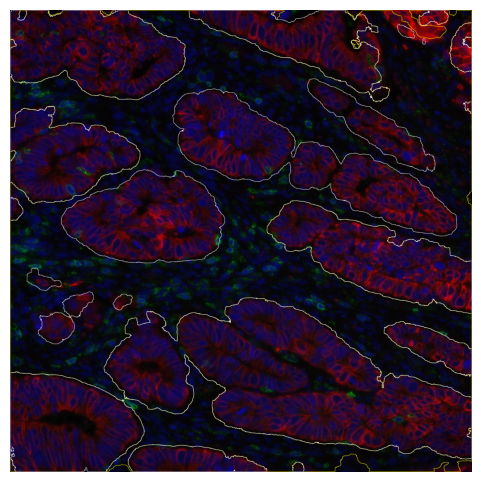
Overlay contours with ground truth
Just as an example, We will overlay this mask with the correspondent immunofluorescent image. In the IF image, nucleus are coloured with DAPI blue, cancer with red and the remaining membranes with green. For the lines, yellow represent the stroma contours and white cancer contours.
It’s possible to see a very good overlap between regions.
Some discrepancies may be due to problems in the IF imaging and the non complete alignment as the IF and the CosMx are made on consecutive slides.
image = tiff.imread('composites/20230628_151317_S4_C902_P99_N99_F001_composite.tiff')

# Calculate the padding needed on each side
pad_y = (image.shape[1] - mask_stroma.shape[1]) // 2
pad_x = (image.shape[0] - mask_stroma.shape[0]) // 2

# Pad the mask with 5 pixels on each side to match the image size
# Here, we assume a binary mask, so we pad with 0s
mask1 = np.pad(mask_stroma, ((pad_y, pad_y), (pad_x, pad_x)), mode='constant', constant_values=0)
mask2 = np.pad(mask_tum, ((pad_y, pad_y), (pad_x, pad_x)), mode='constant', constant_values=0)

# mask1 = np.flip(mask1, axis = 0)
mask1 = np.transpose(mask1)
mask2 = np.transpose(mask2)
image = (image * 255).astype(np.uint8)

# Create a copy of the image to overlay borders
image_with_contours = image.copy()

# Find contours for each mask
contours1, _ = cv2.findContours(mask1.astype(np.uint8), cv2.RETR_EXTERNAL, cv2.CHAIN_APPROX_SIMPLE)
contours2, _ = cv2.findContours(mask2.astype(np.uint8), cv2.RETR_EXTERNAL, cv2.CHAIN_APPROX_SIMPLE)

# Define colors for each mask's contours (Yellow for mask1, Cyan for mask2)
contour_color1 = (255, 255, 0)  # Yellow
contour_color2 = (255, 255, 255)  # Cyan

# Draw the contours on the image
cv2.drawContours(image_with_contours, contours1, -1, contour_color1, thickness=2)
cv2.drawContours(image_with_contours, contours2, -1, contour_color2, thickness=2)

# Plot the image with contours
plt.figure(figsize=(6, 6))  # Increase the figure size to make it larger
plt.imshow(image_with_contours)
plt.axis('off')  # Hide axes for cleaner visualization
plt.show()
Pipeline
Finally, we can wrap it up and make a pipeline that can be applied to the full cohort.
def do_cosmx_pipeline(file_csv):
df_total = pd.read_csv(file_csv)
df_total['X'] = (round(df_total['x'])).astype(int)
df_total['Y'] = (round(df_total['y'])).astype(int)
n_genes = len(df_total['target'].unique())
height = max(df_total['X'] + 1)
width = max(df_total['Y'] + 1)
target_dict_total = {target: index for index, target in enumerate(df_total['target'].unique())}
array_total = ga.transform_df_to_array(df = df_total, target_dict=target_dict_total, array_shape = (height, width,len(target_dict_total))).astype(np.int8)
df_subset_tum, array_subset_tum, target_indices_subset_tum = ga.get_subset_arrays(df_total, array_total,target_dict_total,
target_list=target_tum, target_col = 'target')
# obtain contours
CTum = contours.ConvolutionContours(array_subset_tum, contour_name='tum')
CTum.get_conv_sum(kernel_size=kernel_size_tum, kernel_shape='square')
CTum.contours_from_sum(density_threshold = density_th_tum,
min_area_threshold = min_area_th_tum , directionality = 'higher')
CEmpty = contours.ConvolutionContours(array_total, contour_name='empty')
CEmpty.get_conv_sum(kernel_size=kernel_size_empty, kernel_shape='square')
CEmpty.contours_from_sum(density_threshold = density_th_empty,
min_area_threshold = min_area_th_empty, directionality = 'lower') # attention that directionality is lower here
#### obtain masks
GM = get_masks.GetMasks(image_shape = (height, width))
mask_empty = GM.create_mask(CEmpty.contours)
mask_tum = GM.create_mask(CTum.contours)
mask_tum = GM.fill_holes(mask_tum)
mask_stroma = GM.subtract_masks(np.ones((height, width), dtype=np.uint8), mask_tum, mask_empty)
mask_stroma = GM.filter_binary_mask_by_area(mask_stroma, min_area=700)
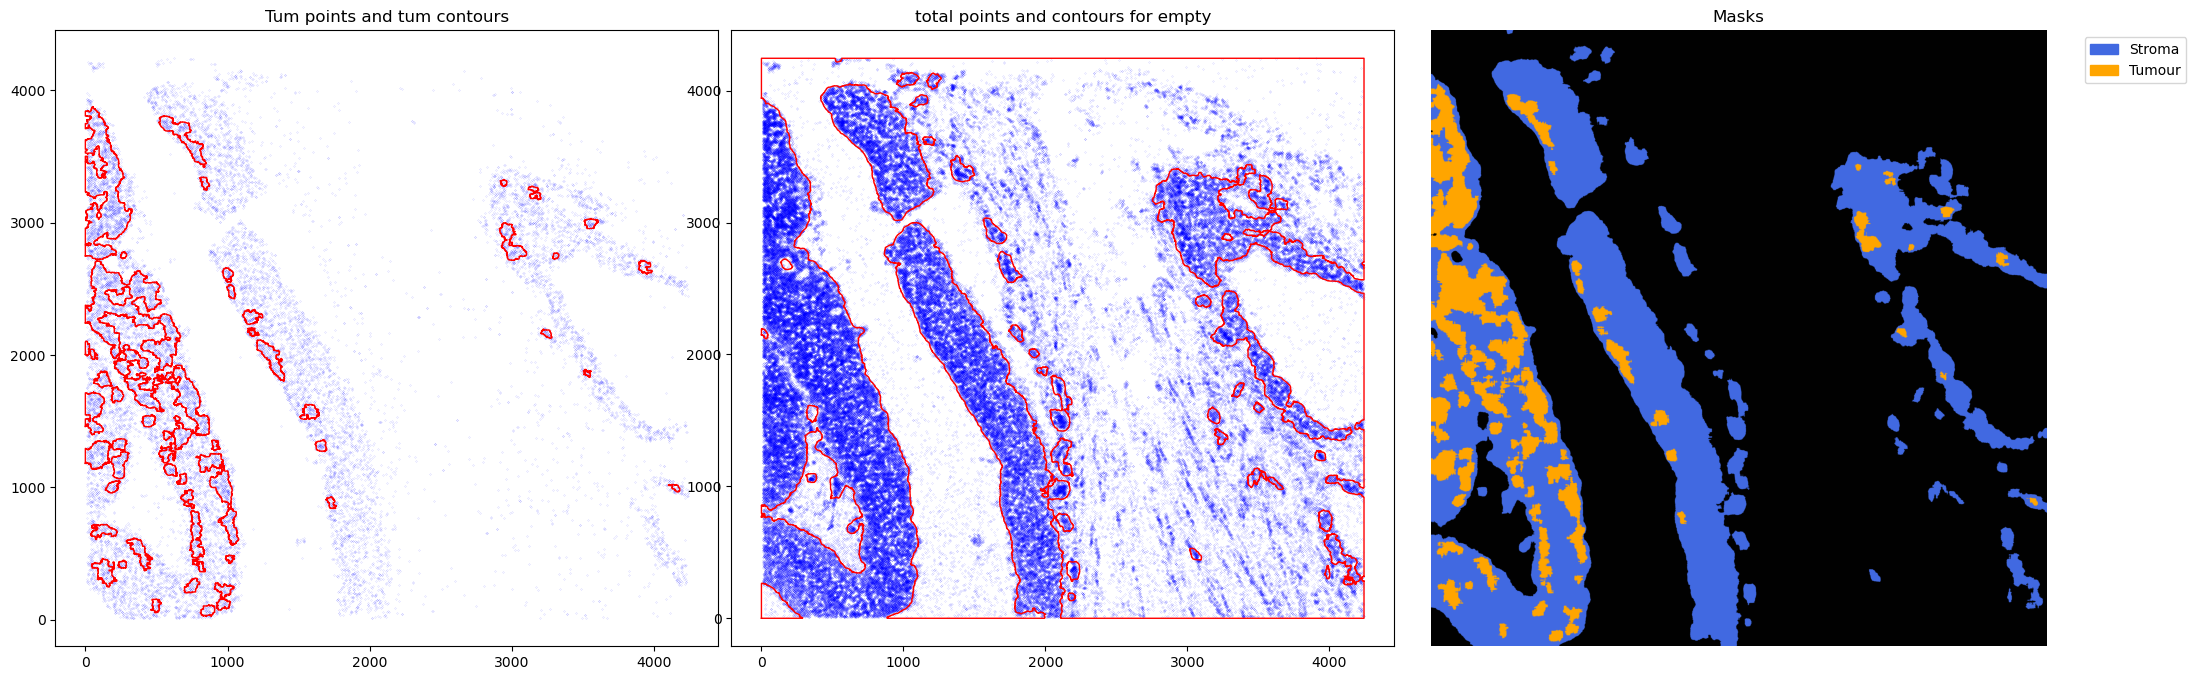
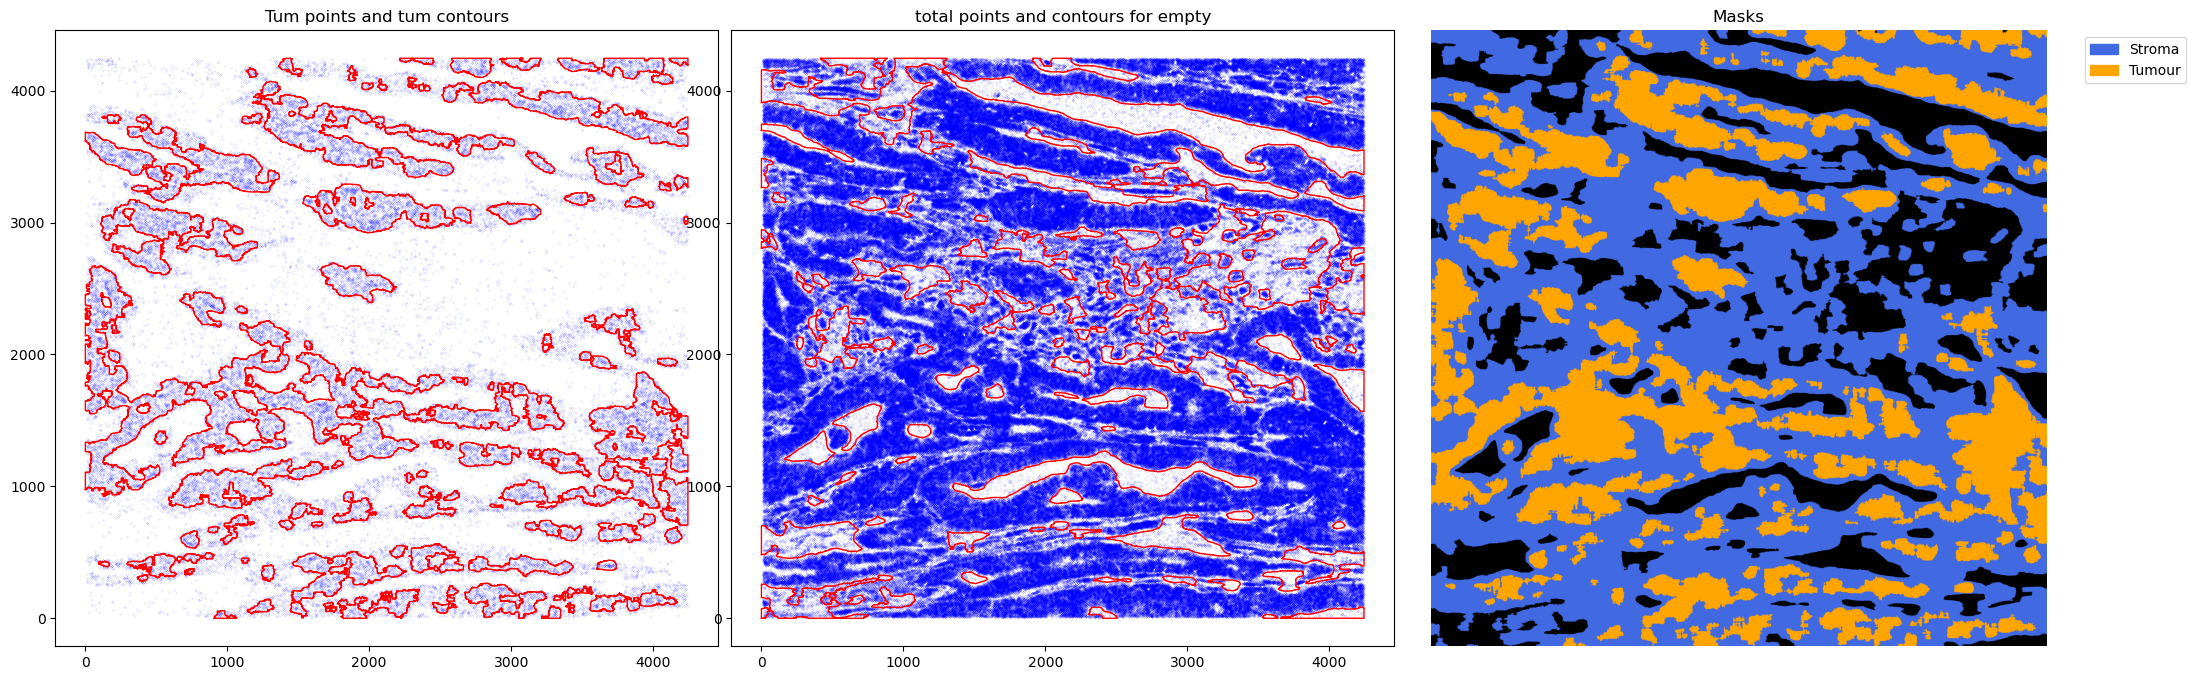
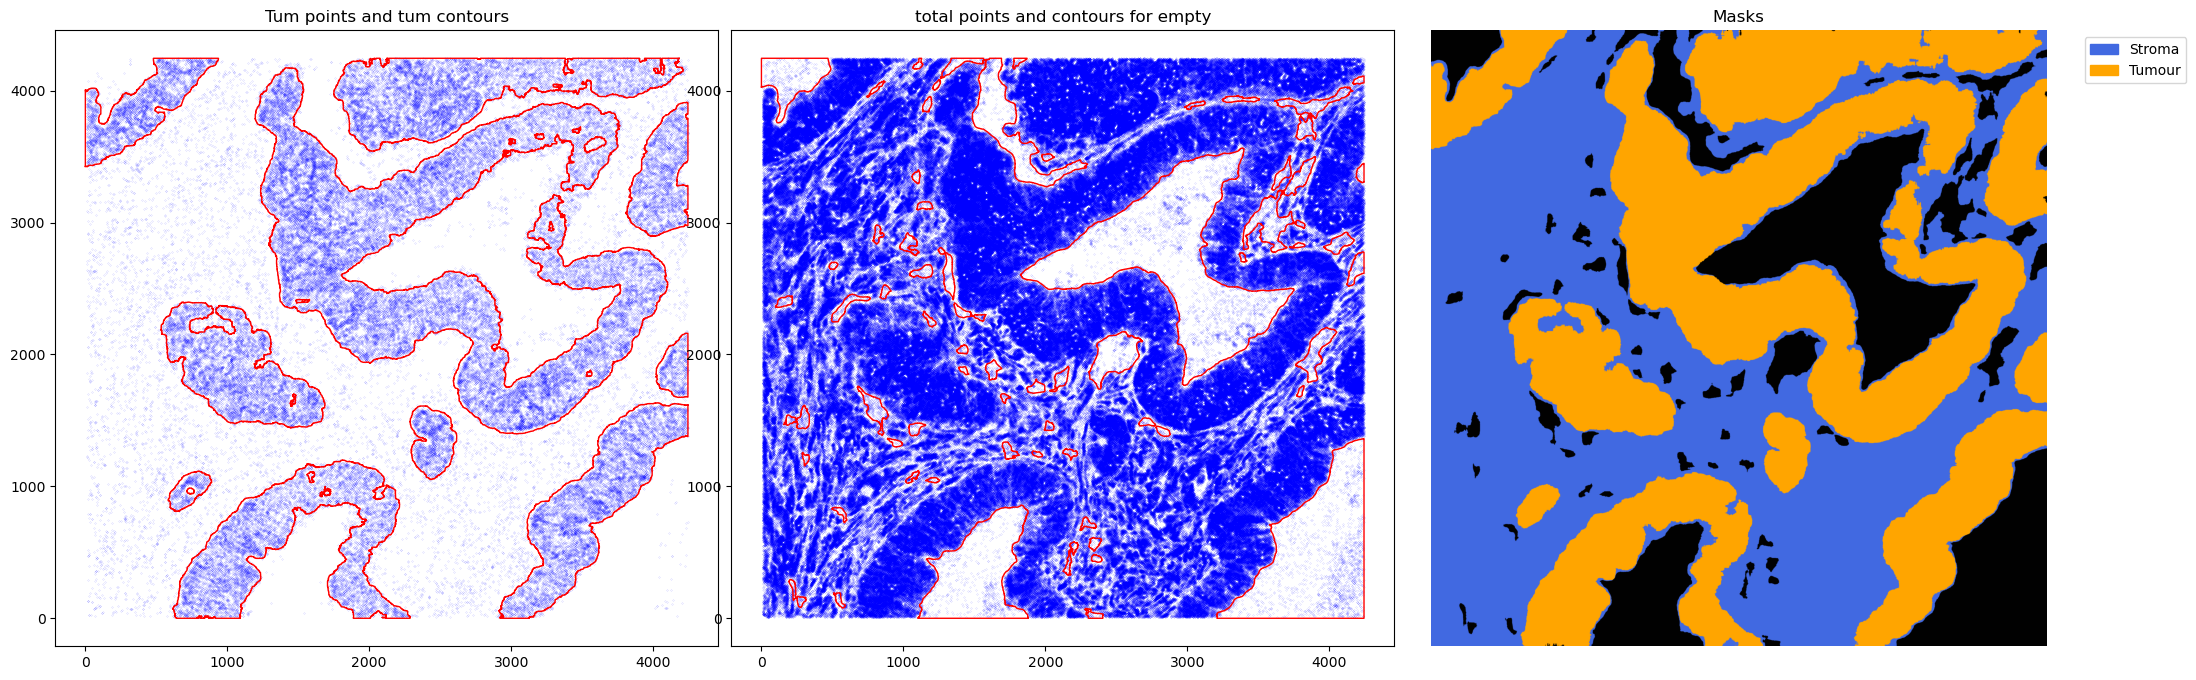
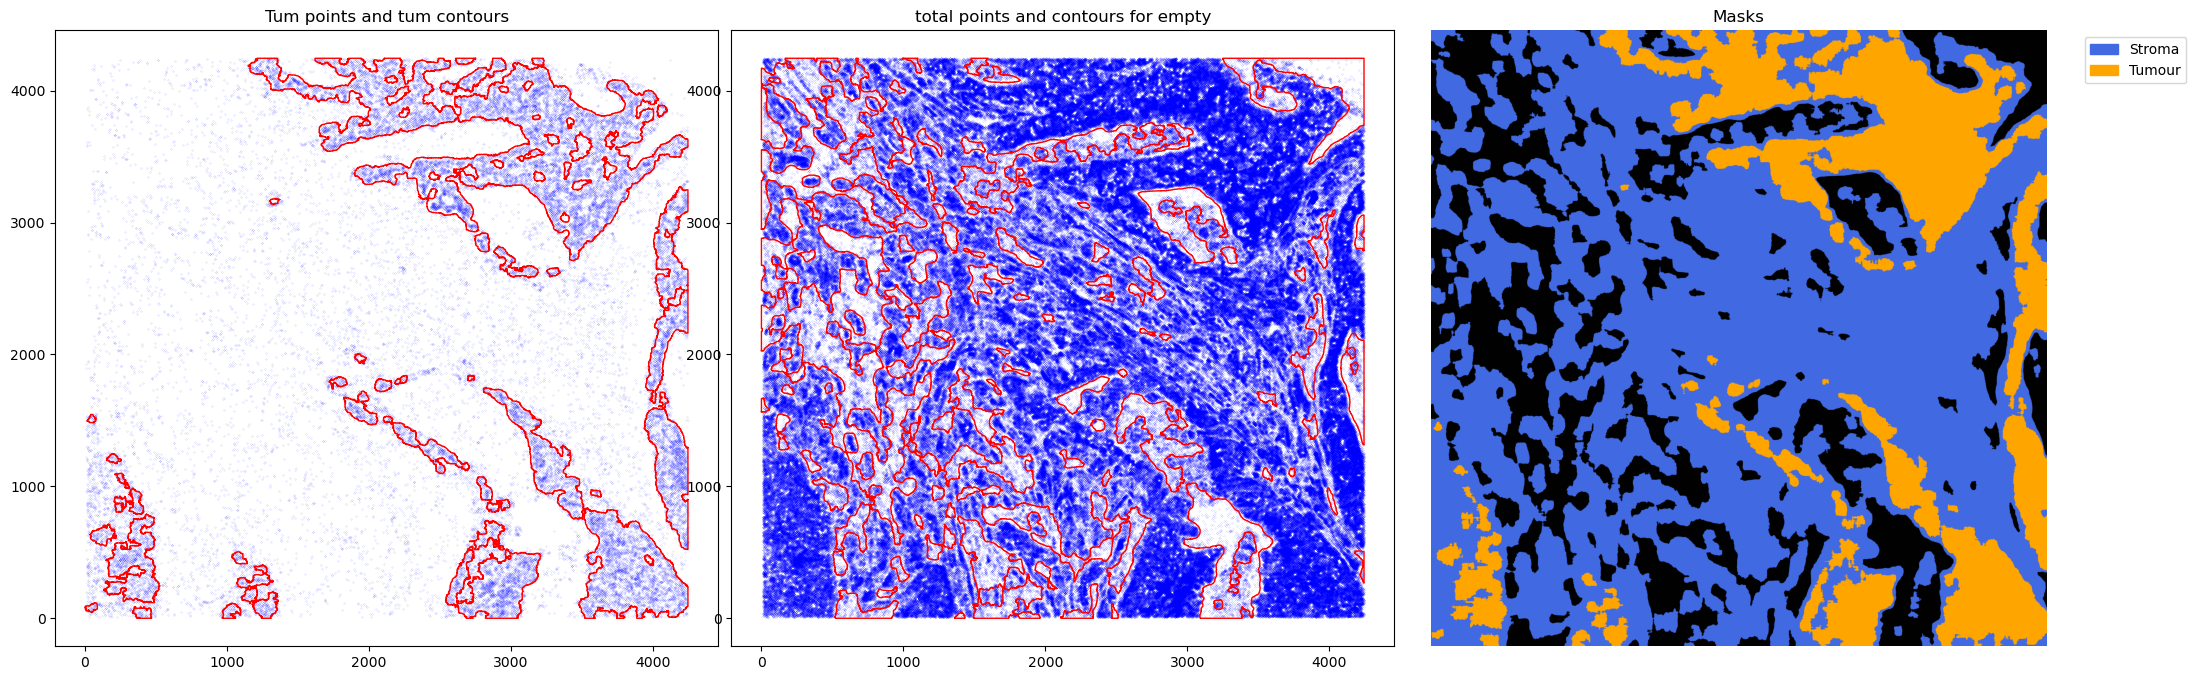
fig, axs = plt.subplots(1, 3, figsize=(26, 8))
CTum.plot_contours_scatter(path=None, show=False, s=0.05, alpha=0.5, linewidth=1,
c_points= 'blue',c_contours= 'red', ax=axs[0])
axs[0].set_title('Tum points and tum contours')
CEmpty.plot_contours_scatter(path=None, show=False, s=0.05, alpha=0.5, linewidth=1,
c_points= 'blue',c_contours= 'red', ax=axs[1])
axs[1].set_title('total points and contours for empty')
plt.subplots_adjust(wspace=0.02) # Adjust to your preference
GM.plot_masks(masks=[mask_stroma, mask_tum], mask_names=['Stroma', 'Tumour'],
background_color=(1, 1, 1), mask_colors={'Stroma': (65, 105, 225), 'Tumour': (255, 165, 0)},
path=None, show=False, ax=axs[2])
axs[2].set_title('Masks')
plt.show()
%%time

files_names = natsorted(target_files_s0)


for file_csv in tqdm(random.sample(files_names, 5)):
    do_cosmx_pipeline(file_csv)
0%| | 0/5 [00:00<?, ?it/s]2025-06-12 00:17:58,625 - gridgen.contours.tum - INFO - Initialized GetContour
get_conv_sum took 0.5004 seconds
2025-06-12 00:17:59,422 - gridgen.contours.tum - INFO - Number of contours after filtering no counts: 50
2025-06-12 00:17:59,424 - gridgen.contours.empty - INFO - Initialized GetContour
contours_from_sum took 0.2980 seconds
get_conv_sum took 8.3673 seconds
2025-06-12 00:18:15,952 - gridgen.contours.empty - INFO - Number of contours after filtering no counts: 38
2025-06-12 00:18:15,954 - gridgen.get_masks.GetMasks - INFO - Initialized GetMasks
2025-06-12 00:18:15,977 - gridgen.get_masks.GetMasks - INFO - Subtracted masks from base mask.
contours_from_sum took 8.1620 seconds
20%|█████████████████████████████ | 1/5 [00:44<02:58, 44.62s/it]2025-06-12 00:18:45,623 - gridgen.contours.tum - INFO - Initialized GetContour
get_conv_sum took 0.4942 seconds
2025-06-12 00:18:46,482 - gridgen.contours.tum - INFO - Number of contours after filtering no counts: 143
2025-06-12 00:18:46,484 - gridgen.contours.empty - INFO - Initialized GetContour
contours_from_sum took 0.3665 seconds
get_conv_sum took 8.9198 seconds
2025-06-12 00:19:04,129 - gridgen.contours.empty - INFO - Number of contours after filtering no counts: 98
2025-06-12 00:19:04,130 - gridgen.get_masks.GetMasks - INFO - Initialized GetMasks
2025-06-12 00:19:04,176 - gridgen.get_masks.GetMasks - INFO - Subtracted masks from base mask.
contours_from_sum took 8.7253 seconds
40%|██████████████████████████████████████████████████████████ | 2/5 [01:33<02:21, 47.25s/it]2025-06-12 00:19:34,796 - gridgen.contours.tum - INFO - Initialized GetContour
get_conv_sum took 0.4984 seconds
2025-06-12 00:19:35,602 - gridgen.contours.tum - INFO - Number of contours after filtering no counts: 22
2025-06-12 00:19:35,603 - gridgen.contours.empty - INFO - Initialized GetContour
contours_from_sum took 0.3084 seconds
get_conv_sum took 8.7965 seconds
2025-06-12 00:19:52,984 - gridgen.contours.empty - INFO - Number of contours after filtering no counts: 71
2025-06-12 00:19:52,985 - gridgen.get_masks.GetMasks - INFO - Initialized GetMasks
2025-06-12 00:19:53,009 - gridgen.get_masks.GetMasks - INFO - Subtracted masks from base mask.
contours_from_sum took 8.5849 seconds
60%|███████████████████████████████████████████████████████████████████████████████████████ | 3/5 [02:22<01:35, 47.96s/it]2025-06-12 00:20:23,254 - gridgen.contours.tum - INFO - Initialized GetContour
get_conv_sum took 0.4986 seconds
2025-06-12 00:20:24,075 - gridgen.contours.tum - INFO - Number of contours after filtering no counts: 61
2025-06-12 00:20:24,076 - gridgen.contours.empty - INFO - Initialized GetContour
contours_from_sum took 0.3236 seconds
get_conv_sum took 7.9559 seconds
2025-06-12 00:20:39,857 - gridgen.contours.empty - INFO - Number of contours after filtering no counts: 103
2025-06-12 00:20:39,858 - gridgen.get_masks.GetMasks - INFO - Initialized GetMasks
2025-06-12 00:20:39,888 - gridgen.get_masks.GetMasks - INFO - Subtracted masks from base mask.
contours_from_sum took 7.8252 seconds
80%|████████████████████████████████████████████████████████████████████████████████████████████████████████████████████ | 4/5 [03:08<00:47, 47.11s/it]2025-06-12 00:21:09,933 - gridgen.contours.tum - INFO - Initialized GetContour
get_conv_sum took 0.4956 seconds
2025-06-12 00:21:10,728 - gridgen.contours.tum - INFO - Number of contours after filtering no counts: 19
2025-06-12 00:21:10,729 - gridgen.contours.empty - INFO - Initialized GetContour
contours_from_sum took 0.2950 seconds
get_conv_sum took 8.9202 seconds
2025-06-12 00:21:28,368 - gridgen.contours.empty - INFO - Number of contours after filtering no counts: 73
2025-06-12 00:21:28,368 - gridgen.get_masks.GetMasks - INFO - Initialized GetMasks
2025-06-12 00:21:28,391 - gridgen.get_masks.GetMasks - INFO - Subtracted masks from base mask.
contours_from_sum took 8.7183 seconds
100%|█████████████████████████████████████████████████████████████████████████████████████████████████████████████████████████████████████████████████| 5/5 [03:57<00:00, 47.59s/it]
CPU times: user 2min 50s, sys: 52.7 s, total: 3min 43s
Wall time: 3min 57s